Making the UI Part of the Prompt: Building Context-Aware Enterprise AI for Analytics
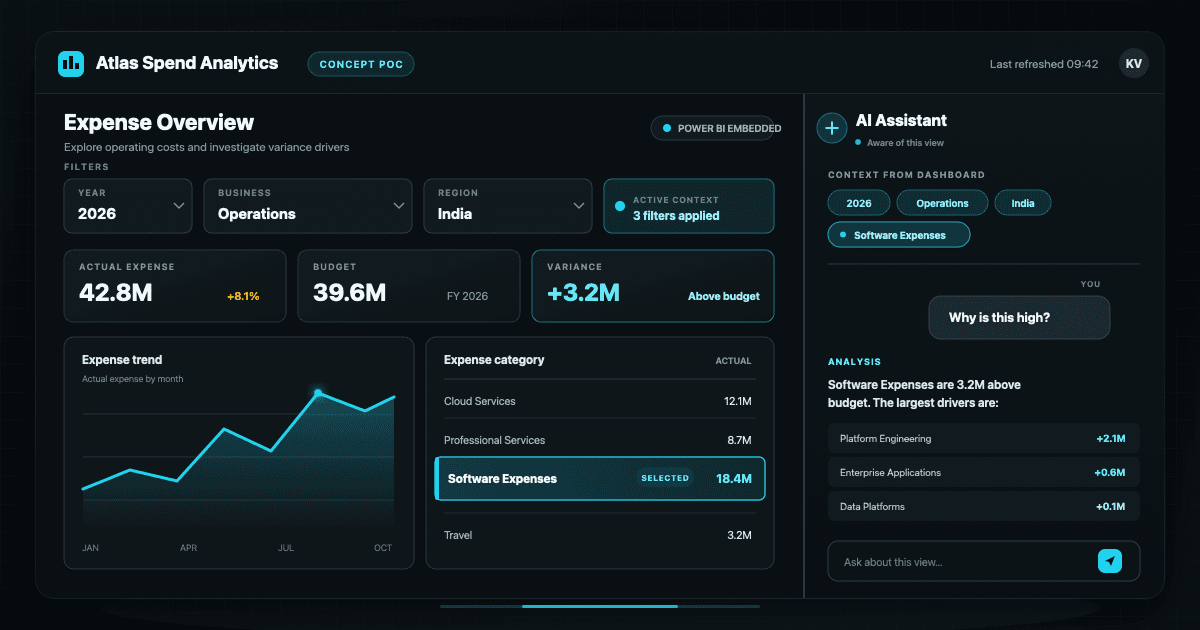
A user is looking at an expense dashboard.
They selected Year: 2026, Business: Operations, and Region: India. The table shows Software Expenses: 18.4M.
They click that number and ask:
“Why is this high?”
That should be enough.
A colleague beside the user understands “this” because they can see the number and every selection behind it.
A standalone chatbot sees only four words.
The difficult part is giving the AI the context behind the number without making the user type it again.
What if the UI itself could help complete the prompt?
That was the idea behind a proof of concept I built with Power BI Embedded, semantic model knowledge, and dynamic DAX generation.
All names, categories, organisational labels, and values in this article are fictional and illustrative.
The user should be able to point and ask
Most enterprise chatbot experiences begin with an empty input box. That design assumes the user must express the whole problem as text.
An analytics application is different. Before asking a question, the user has already navigated to a page, applied slicers, filtered the data, and selected something worth investigating.
In this example, the user points to 18.4M. The number sits inside a clear analytical context:
- Page: Expense Overview
- Year: 2026
- Business: Operations
- Region: India
- Expense Category: Software Expenses
The prompt can remain simple:
“Why is this high?”
The application sends that short question together with the structured context behind the selected number. The AI can then decide what comparison, breakdown, or query it needs to investigate the result.
That was the product interaction I wanted to explore: point to a number, ask a natural question, and let the application carry the context.
This is not really a prompt-writing problem. It is a context handoff problem.
We spend a lot of time teaching users to write better prompts. I wanted to see how much of the prompt the application could understand for them.
Why I built the POC
I already had three useful assets:
- Power BI as the analytics and exploration platform.
- A custom enterprise AI and chatbot platform.
- Governed Power BI semantic models containing business logic.
The problem was that the two user experiences were disconnected.
Power BI was good at slicers, filtering, navigation, visual interaction, and exploration. The LLM was good at understanding natural-language intent, planning an analysis, generating queries, and explaining results.
My goal was not to replace one with the other. It was to make them work together.
Power BI already has Copilot capabilities for interacting with reports and semantic models. But my use case was slightly different. I was working with an existing enterprise AI platform and wanted to understand whether that chatbot could become aware of what a user was doing inside Power BI.
The question I wanted to answer was:
“How can an organisation's existing chatbot understand what a user is looking at in a BI application?”
The architecture I had in mind
Application context and semantic model knowledge met at the reasoning layer, where the model could plan an analysis, generate a constrained query, and explain the results.
Power BI was the exploration layer. The semantic model was the analytical contract. The LLM was the reasoning layer.
The UI did not need to become a data export mechanism, and the LLM did not need to recreate the report.
Step one: embed the report
I intentionally did not rebuild the Power BI dashboard as a custom React dashboard.
The report already contained business logic, measures, relationships, security, and familiar interactions. Rebuilding it would have created a second analytics surface to maintain.
I used Power BI Embedded for my organisation and placed the report inside a custom web application. Conceptually, the shell was simple:
┌──────────────────────────────┬──────────────────┐
│                              │                  │
│     Power BI Embedded        │    AI Chat       │
│                              │                  │
└──────────────────────────────┴──────────────────┘The report remained the place for exploration. The chat panel was available when the user needed an explanation.
First prove that the app can read Power BI context
Before connecting an LLM, I tested one basic question:
“Can my host application understand what is happening inside the embedded report?”
The first version rendered the active page and three slicer values outside Power BI:
Current Power BI Context

Page    Expense Overview
Year    2026
Business Operations
Region  India
There was no AI, DAX, or agent. This isolated the Power BI integration problem.
Prove the context flow before adding the LLM.
{
  "page": "Expense Overview",
  "filters": {
    "Year": [2026],
    "Business": ["Operations"],
    "Region": ["India"]
  }
}If a slicer value did not appear, I knew the fault was in context capture—not in a prompt, agent, or query.
Capturing pages, slicers, and filters
The Power BI Embedded JavaScript APIs let a host application interact with a report. I used the active page, report and page filters, slicer states, and embedded report events as source signals.
I translated those signals into one stable application contract:
interface PowerBIContext {
  page: string;
  reportFilters: FilterContext[];
  pageFilters: FilterContext[];
  slicerFilters: FilterContext[];
  selectionFilters: FilterContext[];
}
The normalised output looked more like this:
{
  "page": "Expense Overview",
  "filters": [
    {
      "table": "Date",
      "column": "Year",
      "values": [2026]
    },
    {
      "table": "Management Unit",
      "column": "Business",
      "values": ["Operations"]
    },
    {
      "table": "Management Unit",
      "column": "Region",
      "values": ["India"]
    }
  ]
}
The application absorbed the different Power BI event structures and provided the AI one stable context object.
A page-change listener, for example, only needed to update the application state and trigger a refresh:
report.on("pageChanged", async (event) => {
  currentContext.page =
    event.detail.newPage.displayName;

  await refreshPowerBIContext();
});
These examples are intentionally simplified. A production implementation depends on the report design, semantic model, authentication architecture, and enterprise AI platform.
The interesting part: what did the user click?
The useful interaction was not only a page or slicer. It was a data point inside a visual.
| Expense Category | Actual |
|---|---|
| Technology | 12.1M |
| Professional Services | 8.7M |
| Software Expenses | 18.4M |
| Travel | 3.2M |
The user clicks Software Expenses, then asks, “Why is this high?”
Power BI Embedded's dataSelected event lets the host detect a selected data point. My listener reduced the event to usable selection filters:
report.on("dataSelected", (event) => {
  const detail = event.detail;

  const selectionFilters =
    extractValidColumnFilters(detail.filters);

  currentContext.selectionFilters =
    selectionFilters;
});
The important design decision was what happened next.
I did not pass the entire selection payload directly to the chatbot.
Context is not the same as visual data
Imagine the selected visual row contains four values:
| Expense Category | Actual | Budget | Variance |
|---|---|---|---|
| Software Expenses | 18.4M | 15.2M | 3.2M |
What I wanted as analytical context was:
Expense Category = Software ExpensesI did not want to automatically turn the displayed measure values into query predicates:
Actual = 18.4M
Budget = 15.2M
Variance = 3.2M
Measures can be used in DAX queries. But my query builder applied context through model columns, so measure and calculated display values should not automatically become filter predicates.
I therefore kept only approved column-based filters:
function isValidContextFilter(
  filter: SelectionFilter
): boolean {
  if (!filter.table) return false;
  if (!filter.column) return false;
  if (!filter.values?.length) return false;

  return allowedModelColumns.has(
    `${filter.table}.${filter.column}`
  );
}
The sanitation rules were deliberately plain:
- The filter must reference an approved table and column.
- It must contain selected values and be supported by the query builder.
- Measure values are discarded as selection context.
- Raw
dataPointsare not blindly forwarded to the chatbot.
After sanitation, the useful payload was small:
{
  "page": "Expense Overview",
  "filters": {
    "Year": [2026],
    "Business": ["Operations"],
    "Region": ["India"]
  },
  "selection": {
    "Expense Category": ["Software Expenses"]
  }
}The context chips made hidden state visible and created a future place for users to remove it.
Power BI context tells the AI what the user means—not why it happened
Capturing Software Expenses solved the “what does this mean?” problem. It did not solve the analytical problem.
Power BI context told the application that the user was asking about Software Expenses. It did not establish that Software Expenses increased because Platform Engineering drove a 2.1M year-over-year increase.
That required analysis.
This was the point where the semantic model became important.
The semantic model becomes the AI's analytical map
The LLM needed knowledge of the Power BI semantic model: its tables, columns, measures, relationships, and business descriptions.
For the POC, the relevant surface looked roughly like this:
TABLES

Dim Date
  Date · Year · Month · Quarter

Expense
  Management Unit ID · Account ID · Expense Category ID

Expense Category
  Expense Category · Expense Group

Management Unit
  MU ID · MU Name · Business · Region

MEASURES

[Actual Expense] · [Budget Expense] · [Expense Variance]
[Expense Variance %] · [Prior Year Expense] · [YoY Variance]
Descriptions added business meaning:
[Actual Expense]
Total posted actual expense for the selected analysis period
and business context.

[Expense Variance]
Actual Expense minus Budget Expense.
The semantic model becomes an analytical contract between the business logic and the AI.
The governed layer was more useful than raw warehouse tables because it contained reusable measures and business definitions. It did not guarantee accuracy; it gave the LLM a smaller analytical surface.
From a vague question to an analysis plan
The AI now had three inputs:
Question
Why is this high?

Context
Year = 2026
Business = Operations
Region = India
Expense Category = Software Expenses

Semantic model knowledge
Tables · columns · measures · relationships · descriptions
I wanted the first reasoning step to be an analytical plan, not an immediate query.
Intent
Explain unusually high Software Expenses.

Analysis plan
1. Compare against prior year.
2. Review the monthly trend.
3. Identify the largest management unit contributors.
4. Rank positive year-over-year variance drivers.
The LLM was not converting one sentence into one predefined DAX query. It chose the analytical views required from the question, UI context, and semantic model.
Dynamic DAX generation
One planned query ranked the management units contributing most to the increase:
DEFINE
    VAR __YearFilter =
        TREATAS(
            { 2026 },
            'Dim Date'[Year]
        )

    VAR __BusinessFilter =
        TREATAS(
            { "Operations" },
            'Management Unit'[Business]
        )

    VAR __RegionFilter =
        TREATAS(
            { "India" },
            'Management Unit'[Region]
        )

    VAR __ExpenseCategoryFilter =
        TREATAS(
            { "Software Expenses" },
            'Expense Category'[Expense Category]
        )

EVALUATE

TOPN(
    10,
    SUMMARIZECOLUMNS(
        'Management Unit'[MU Name],

        __YearFilter,
        __BusinessFilter,
        __RegionFilter,
        __ExpenseCategoryFilter,

        "Actual Expense",
            [Actual Expense],

        "Prior Year Expense",
            [Prior Year Expense],

        "YoY Variance",
            [YoY Variance]
    ),
    [YoY Variance],
    DESC
)

ORDER BY
    [YoY Variance] DESC
The filter values came from the UI context. The selected measures came from semantic model knowledge. The grouping came from the analytical plan.
The result set was compact:
| MU Name | Actual | Prior Year | YoY Variance |
|---|---|---|---|
| Platform Engineering | 6.2M | 4.1M | +2.1M |
| Enterprise Applications | 4.8M | 4.2M | +0.6M |
| Data Platforms | 3.1M | 3.0M | +0.1M |
| Workplace Technology | 2.4M | 2.5M | -0.1M |
That supported a concise answer:
“Software Expenses are primarily high because Platform Engineering increased by 2.1M versus the prior year. This management unit accounts for most of the overall increase. Enterprise Applications also increased by 0.6M, while the remaining management units were broadly stable.”
The application and semantic layer supplied the context missing from “Why is this high?”
Don't treat the dashboard as a giant prompt
I could have exported everything visible in the report and sent it to the LLM. I deliberately did not make that the core architecture.
A dashboard can contain many visuals, dozens of measures, totals, repeated information, and calculated display values. Sending all visible data creates noise and couples the AI to the current layout.
I separated context from analysis data.
UI Context
     ↓
Understand Question
     ↓
Plan Analysis
     ↓
Generate DAX
     ↓
Retrieve Required Data
     ↓
Explain Result
Power BI tells the AI where the user is looking. The AI then decides what data it needs to investigate.
When using a REST execution path, the backend can run validated DAX through the Power BI Execute Queries API. The exact execution choice depends on capacity, permissions, identity, and the wider application architecture.
Guardrails for dynamic query generation
I would not give an LLM unrestricted query access to an enterprise analytics model.
The boundary I wanted was:
LLM proposes query
        ↓
Application validates query
        ↓
Backend executes query
Not:
LLM has unrestricted accessIn practice, that meant sanitising context, allowlisting model fields, grounding generation in known metadata, preferring governed measures, validating DAX, rejecting unsupported patterns, limiting results, executing through a backend, and logging queries.
Most importantly, the execution path has to apply the existing Power BI identity and data security model correctly. Context captured in a browser must never become a shortcut around row-level security or model permissions.
The POC development sequence
I developed the proof of concept in layers:
1. Embed an existing Power BI report
        ↓
2. Render the active page outside Power BI
        ↓
3. Capture report and slicer context
        ↓
4. Normalise the context
        ↓
5. Pass context to the enterprise chatbot
        ↓
6. Capture visual selections using dataSelected
        ↓
7. Keep only valid column-based filters
        ↓
8. Add semantic model metadata
        ↓
9. Generate DAX dynamically
        ↓
10. Execute the query and explain the results
This order isolated problems. When the context was wrong, I debugged the Power BI integration. When the DAX was wrong, I reviewed metadata and query generation. When the answer was wrong, I inspected the analysis plan and query results.
Keeping the context layer, query layer, and reasoning layer separate made the POC much easier to debug.
The broader pattern is bigger than Power BI
Power BI was the implementation surface, but the pattern applies to other enterprise applications.
CRM                    → Selected customer
ERP application        → Selected legal entity
Ticketing application  → Selected incident
HR application         → Selected employee population
BI application         → Selected page + filters + data point

                         ↓
                  ENTERPRISE AI
UI interactions are a form of user intent. A selected customer is context. A selected incident is context. A selected legal entity is context. A cross-filtered expense category is context.
That does not mean every click should automatically be sent to an LLM. The host application should intentionally decide which interactions form useful context, expose that context to the user where appropriate, and let it expire when it is no longer relevant.
The broader pattern is not “connect Power BI to a chatbot.” It is “let applications provide structured context to enterprise AI.”
Where I think this could go next
The POC opened practical extensions: multi-turn context, multiple selections, removable context chips, an explicit Ask AI about this action, and context expiry.
An analytical investigation may also require several DAX queries rather than one. The agent could compare periods, inspect the monthly trend, rank drivers, and then suggest follow-up questions based on the evidence it retrieved.
I was also interested in a richer output surface. After the AI completes an analysis, it could render the findings into a generated HTML analytical view with compact charts, tables, and the supporting query trail:
Explore in Power BI
        ↓
Select context
        ↓
Ask a natural question
        ↓
AI plans the analysis
        ↓
Dynamic DAX queries
        ↓
Read concise answer
        ↓
Open detailed generated analysis view
That would preserve the fast chat answer while giving users somewhere to inspect a longer analysis.
Conclusion
The most interesting part of the POC was not DAX generation. It was changing how I thought about context.
A page is context.
A slicer is context.
A filter is context.
A selected table row is context.
The user has already communicated intent through the UI.
Instead of always asking how users can write better prompts, I think there is another question worth asking:
“How much of the prompt can the application understand without asking the user to type it?”
The dashboard does not disappear.
The chatbot does not replace the BI platform.
The two experiences start working together.
And suddenly, a question as simple as “Why is this high?” can be enough.